Advanced Load Balancing - SANO integration
In this lab we will see how we can load balance traffic among different servers based on how busy those servers are using SANO and NS1.
On the first step of this lab, we will configure SevOne to create a new custom metric call 'load' that includes the number of connections plus how busy the CPU is. Also, we will configure an alert to send the value of this new custom metric to Rapid Network Automation (RNA).
The second step will be to configure RNA to process the values received, format them in a way that NS1 understands, and send them to NS1.
Finally we will configure NS1 to change the cost of the different answers based on the value received from SevOne + RNA, therefore when we query for an answer to NS1, it will reply with the server with less connections and CPU load.
NOTE: For a real world scenario, we would recommend using 'Shed Load' rather than 'Cost' to provide a smoother solution by providing more than one response until one of the answers becomes overloaded. However, in this lab we have chosen 'Cost' to see changes on the answers quicker.
Create Aggregation
Log into the NMS
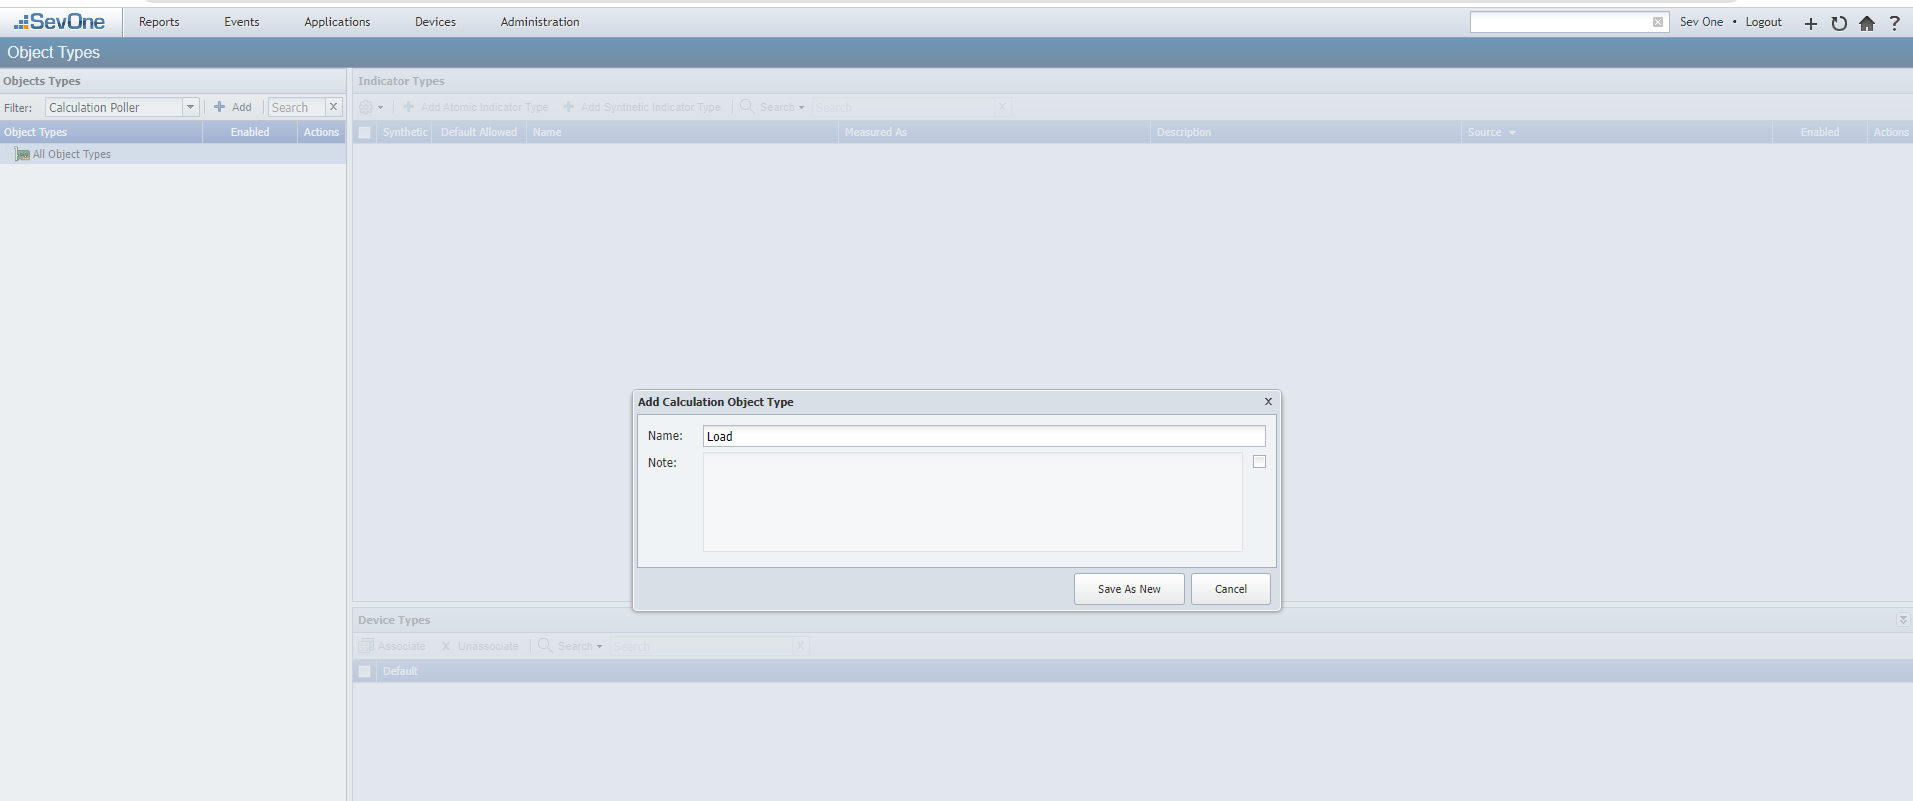
Go to Administration -> Monitoring Configuration -> Object Types
Change Filter to Calculation Poller
Click Add
a. Name: Load
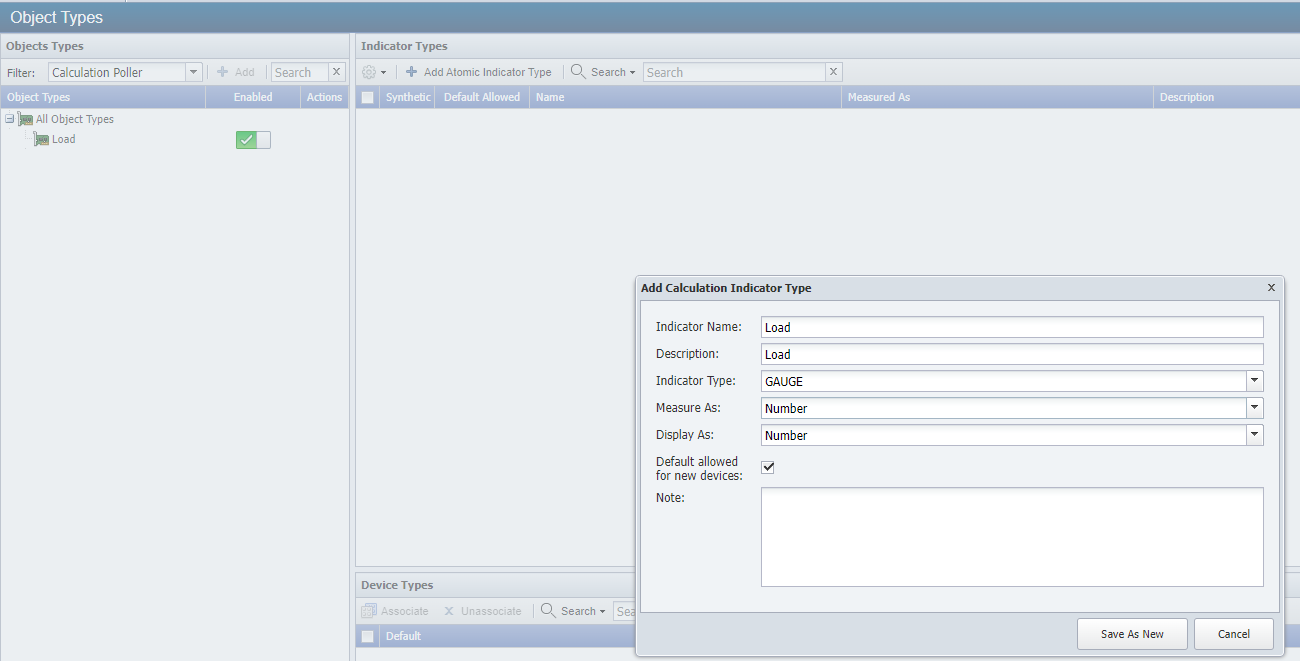
Choose Load:
a. Click Add Atomic Indicator Type
i. Indicator Name: Load

ii. Description: Load

iii. Indicator Type: GAUGE

iv. Measure as: Number

v. Display as: Number
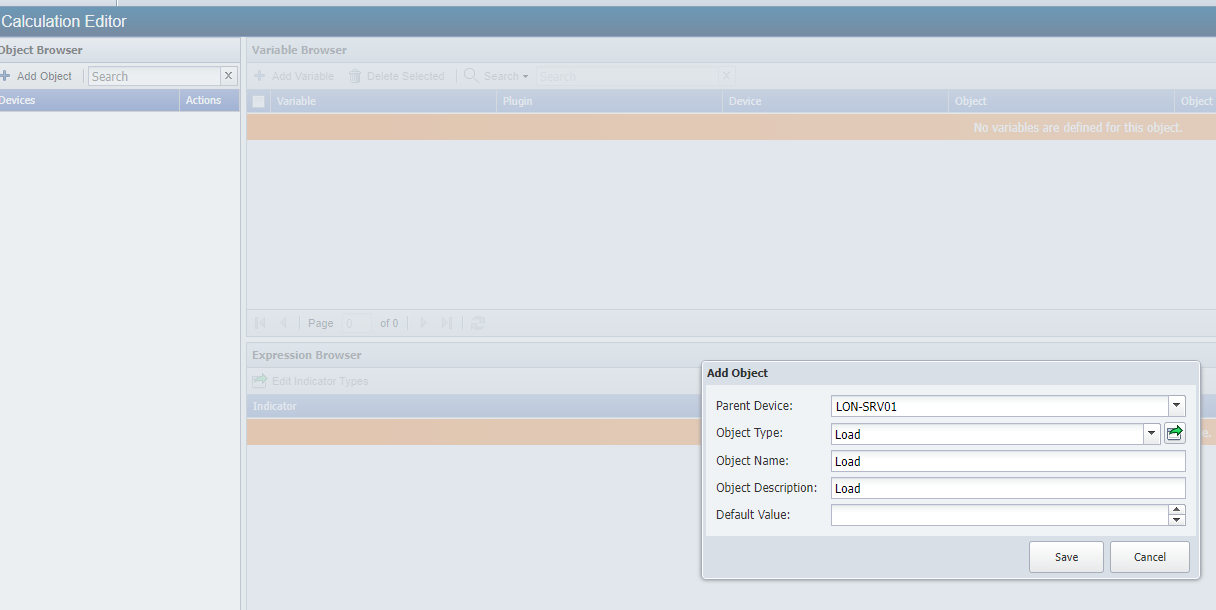
Go to Administration -> Monitoring Configuration -> Calculation Editor
Click ‘Add Object’
a. Parent Device: LON-SRV01
b. Object Type: Calculation Poller -> Load
c. Object Name: Load
d. Object Description: Load
e. Click 'Save'
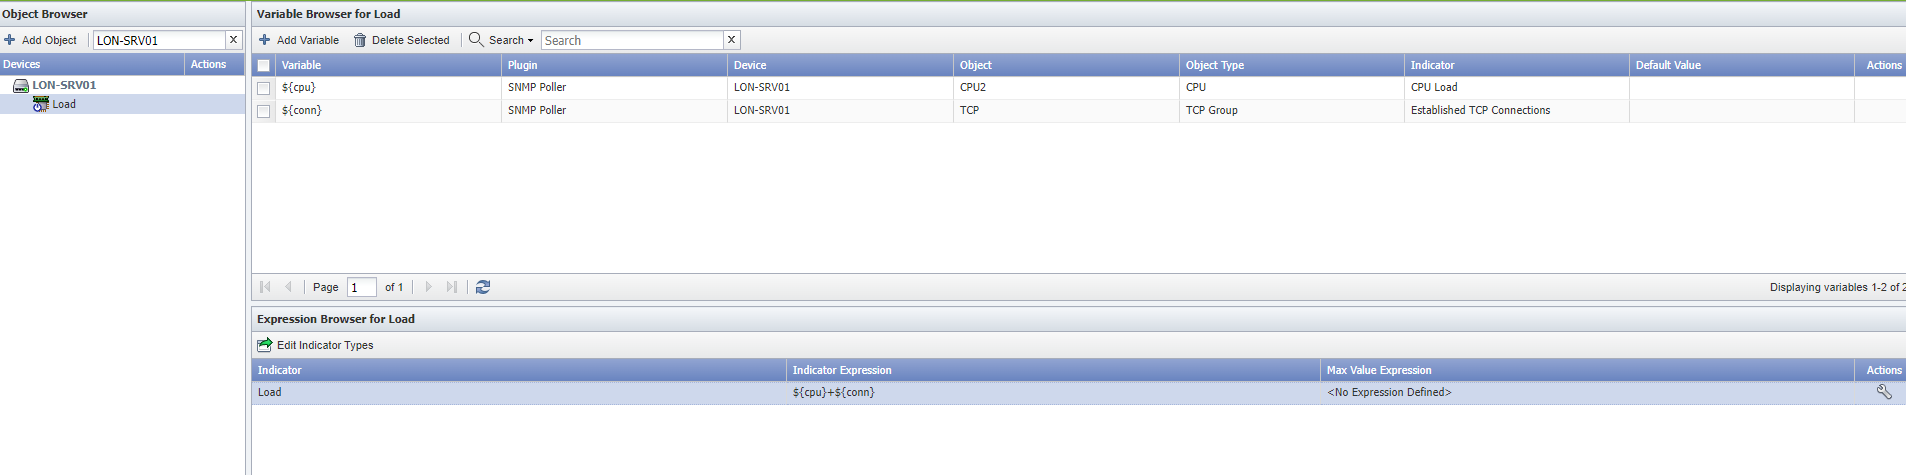
Select the 'Load' object in 'LON-SRV01'
Add Variable:
a. Name: cpu
b. Plugin: SNMP Poller
c. Device: LON-SRV01
d. Object: CPU2
e. Indicator: CPU Load
f. Click 'Save'
Add Variable:
a. Name: conn
b. Plugin: SNMP Poller
c. Device: LON-SRV01
d. Object: TCP
e. Indicator: Established TCP Connections
f. Click 'Save'
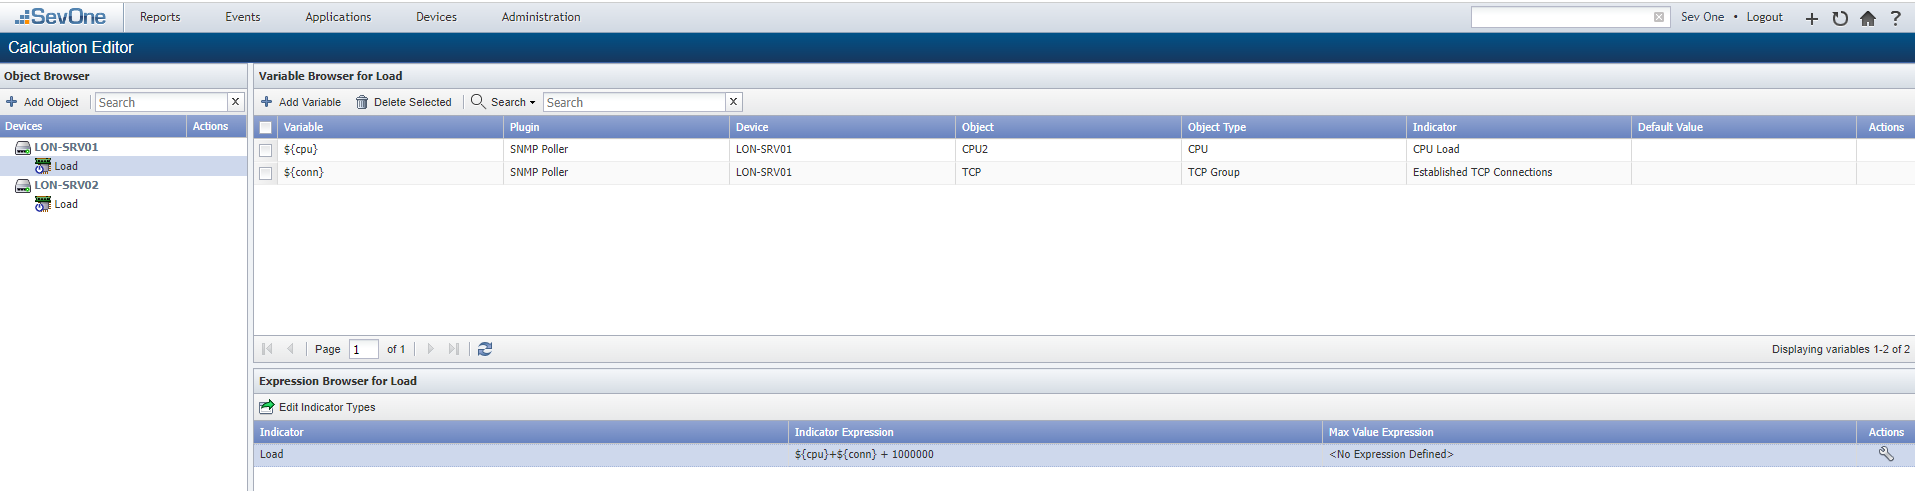
On the section below named 'Expression Browser for Load', click on the spanner symbol of the indicator 'Load'
a. Indicator Expression: $cpu + $conn
b. Click 'Save'
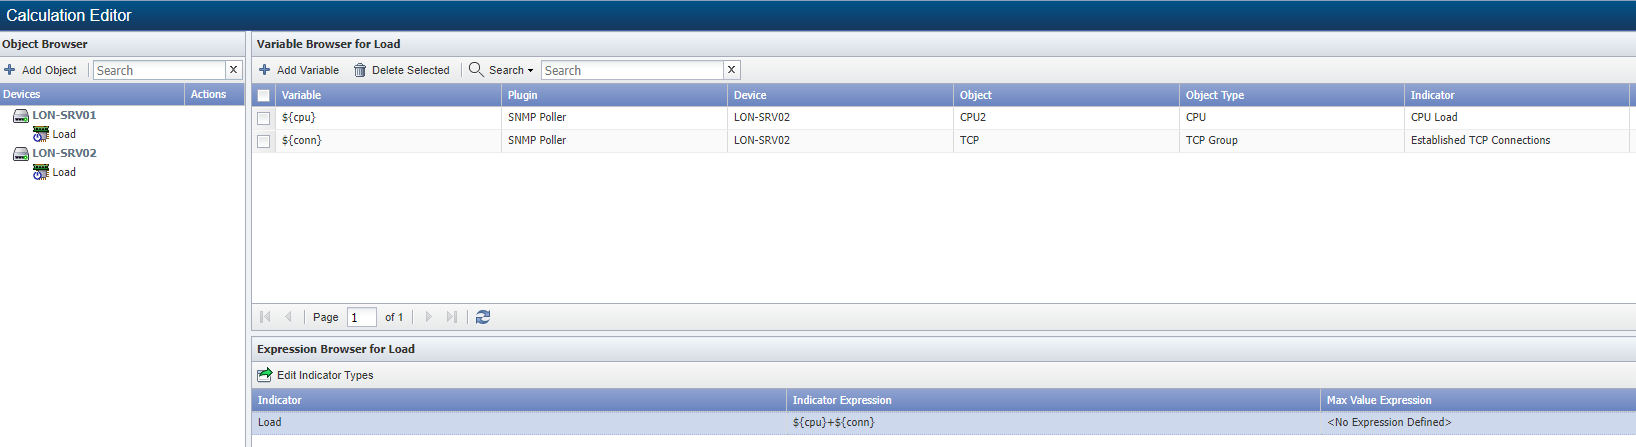
Let's repeat the steps for LON-SRV02
Click ‘Add Object’
a. Parent Device: LON-SRV02
b. Object Type: Calculation Poller -> Load
c. Object Name: Load
d. Object Description: Load
e. Click 'Save'
Select the 'Load' object in 'LON-SRV02'
Add Variable:
a. Name: cpu
b. Plugin: SNMP Poller
c. Device: LON-SRV02
d. Object: CPU2
e. Indicator: CPU Load
f. Click 'Save'
Add Variable:
a. Name: conn
b. Plugin: SNMP Poller
c. Device: LON-SRV02
d. Object: TCP
e. Indicator: Established TCP Connections
f. Click 'Save'
On the section below named 'Expression Browser for Load', click on the spanner symbol of the indicator 'Load'
a. Indicator Expression: $cpu + $conn
b. Click 'Save'
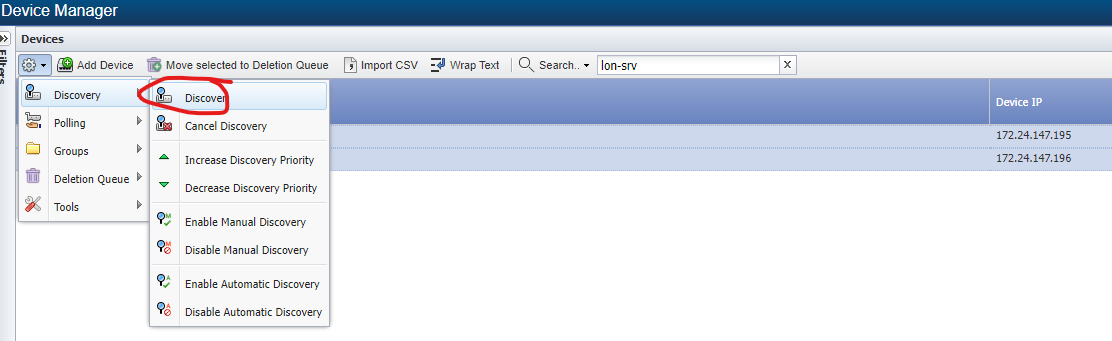
Go to Devices -> Device Manager
a. Search for LON-SRV
b. Select both devices and click on the 'gear' icon on the top left corner -> Discovery -> Discover
Rapid Network Automation Configuration
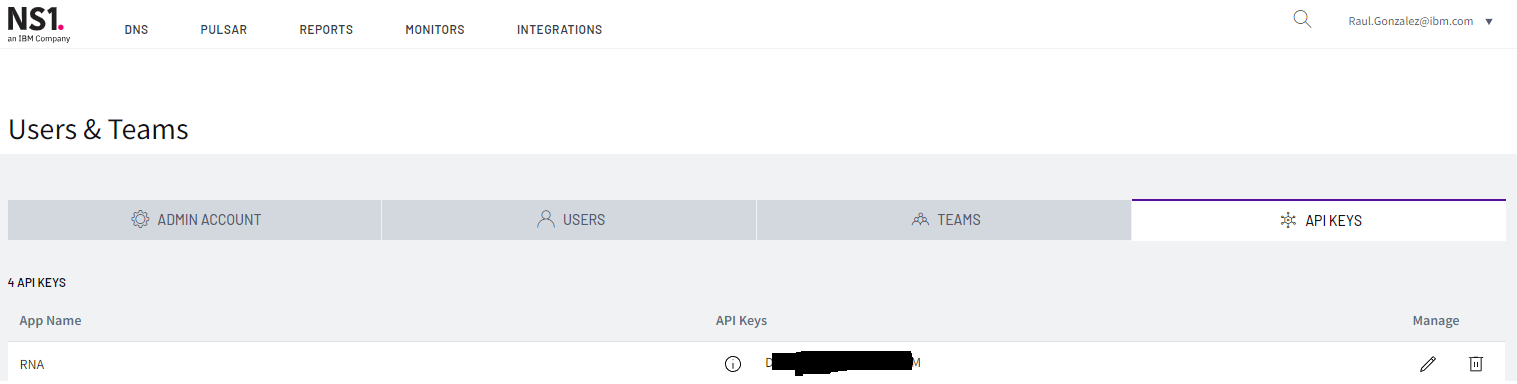
Log into https://my.nsone.net/ with your username and password
Go to the top right corner where you see your username
a. Click on your username -> Settings -> Account Settings
b. Click on 'API KEYS'
c. Click 'Add key'
i. App Name: RNA

ii. Click Save API Key
d. Click on the i icon next to the *** to uncover the API key
i. Copy that API key for future use
Log into Rapid Network Automation platform
Go to Authentications
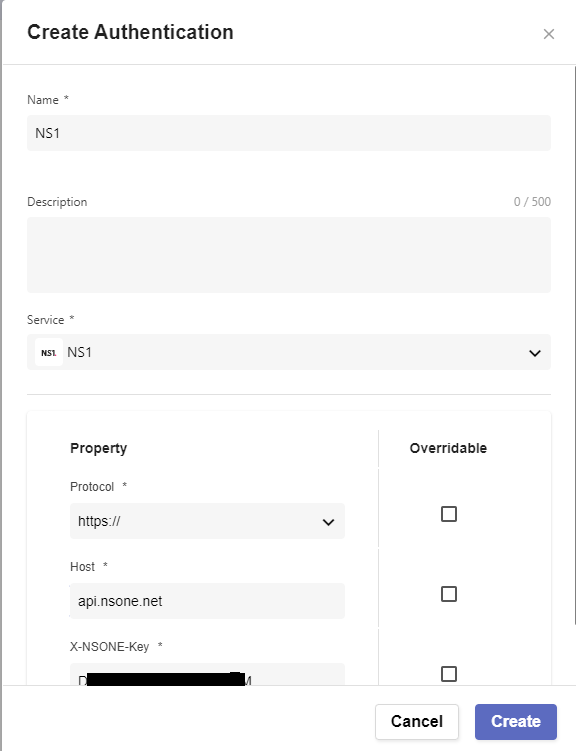
Click 'Create Authentication'
a. Name: NS1
b. Service: NS1
c. Protocol: https://
d. Host: api.nsone.net
e. X-NSONE-key: paste your key from NS1
Go to Workflows
Click 'Create Workflow'
a. Name: SevOne to NS1 Cost
b. Layout type: Sequence
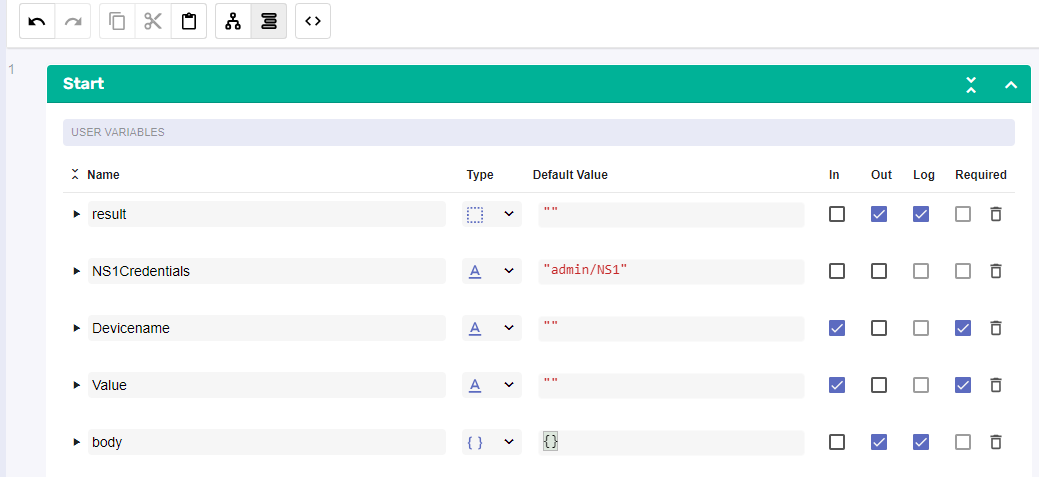
Add variables to Start
a. NS1Credentials
i. Name: NS1Credentials

ii. Type: Authentication -> NS1

iii. Default Value: "admin/NS1"
b. Devicename
i. Name: Devicename

ii. Type: String

iii. Default Value: ""

iv. In

v. Required
c. Value
i. Name: Value

ii. Type: String

iii. Default Value: ""

iv. In

v. Required
d. body
i. Name: body

ii. Type: Object

iii. Default Value: {}

iv. Out

v. Log
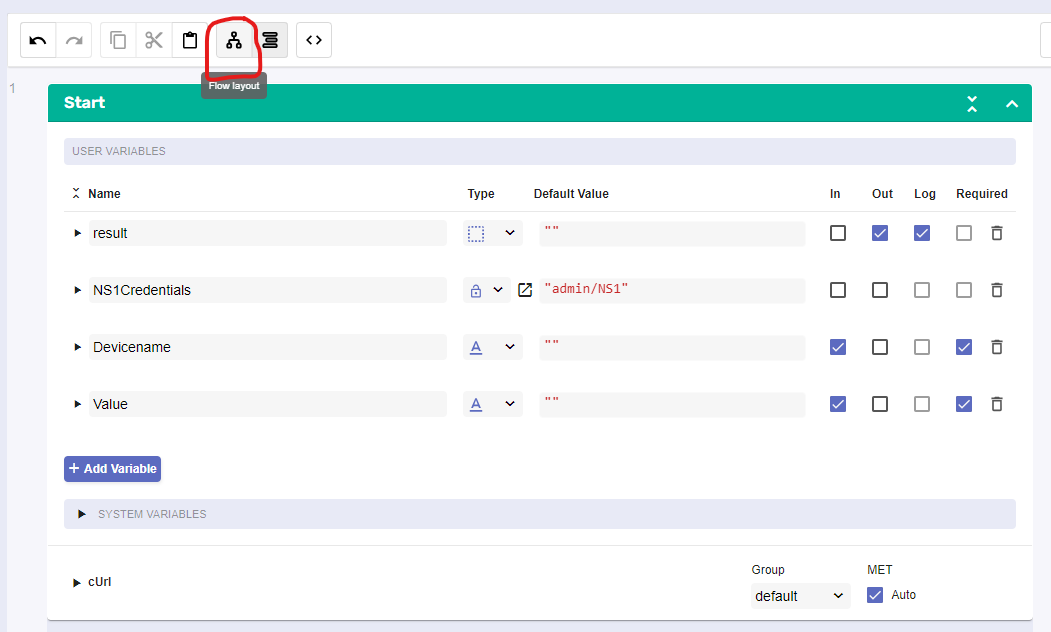
- Change to Flow View
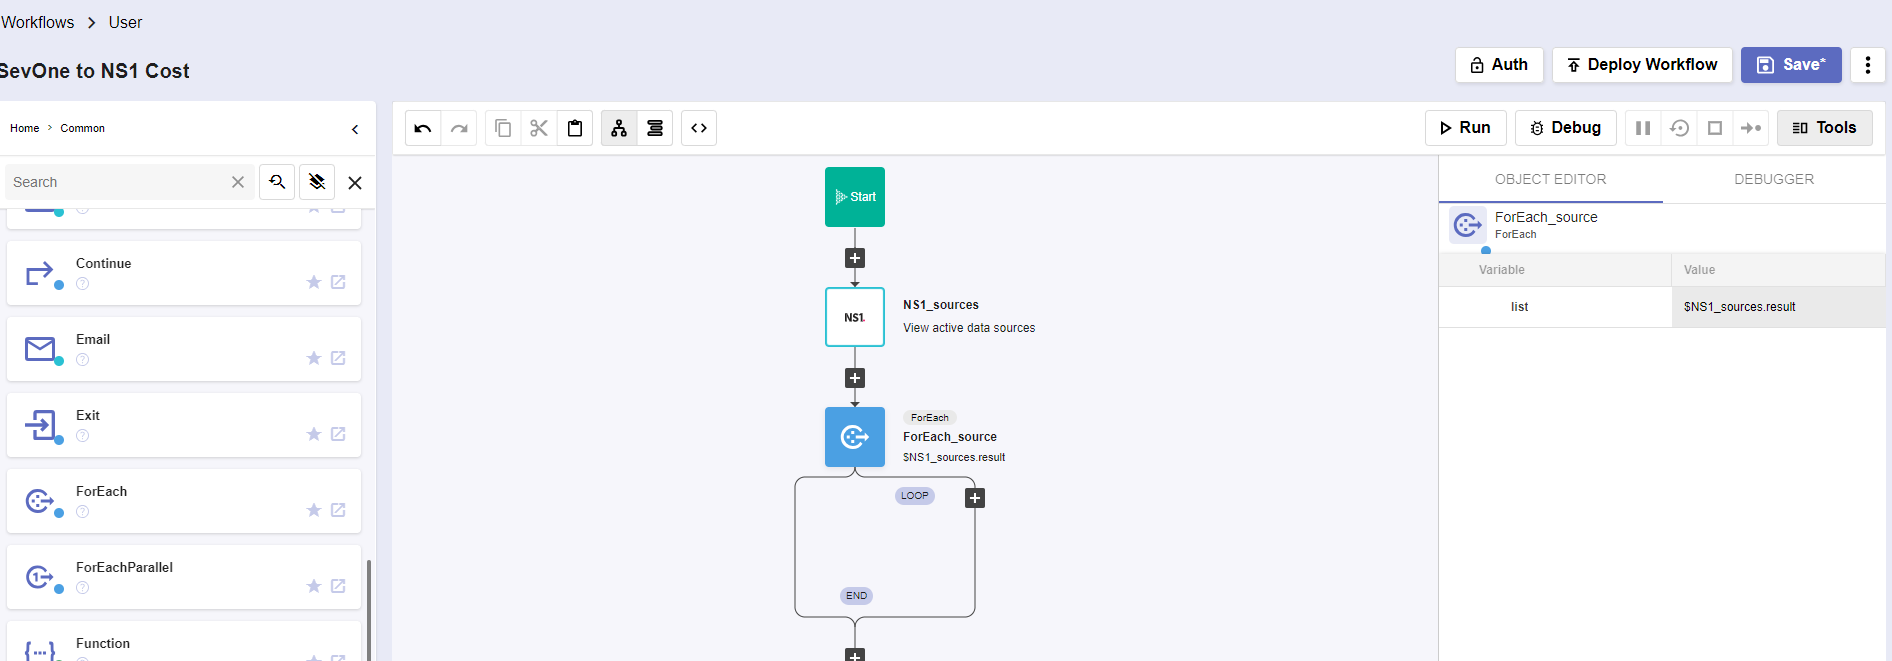
On the left hand side panel, search for NS1, Click on NS1 -> Data Sources & Feeds -> Data Sources -> View active data sources
a. Change name to NS1_sources
b. Click on the building block to open the right side panel and complete the following fields
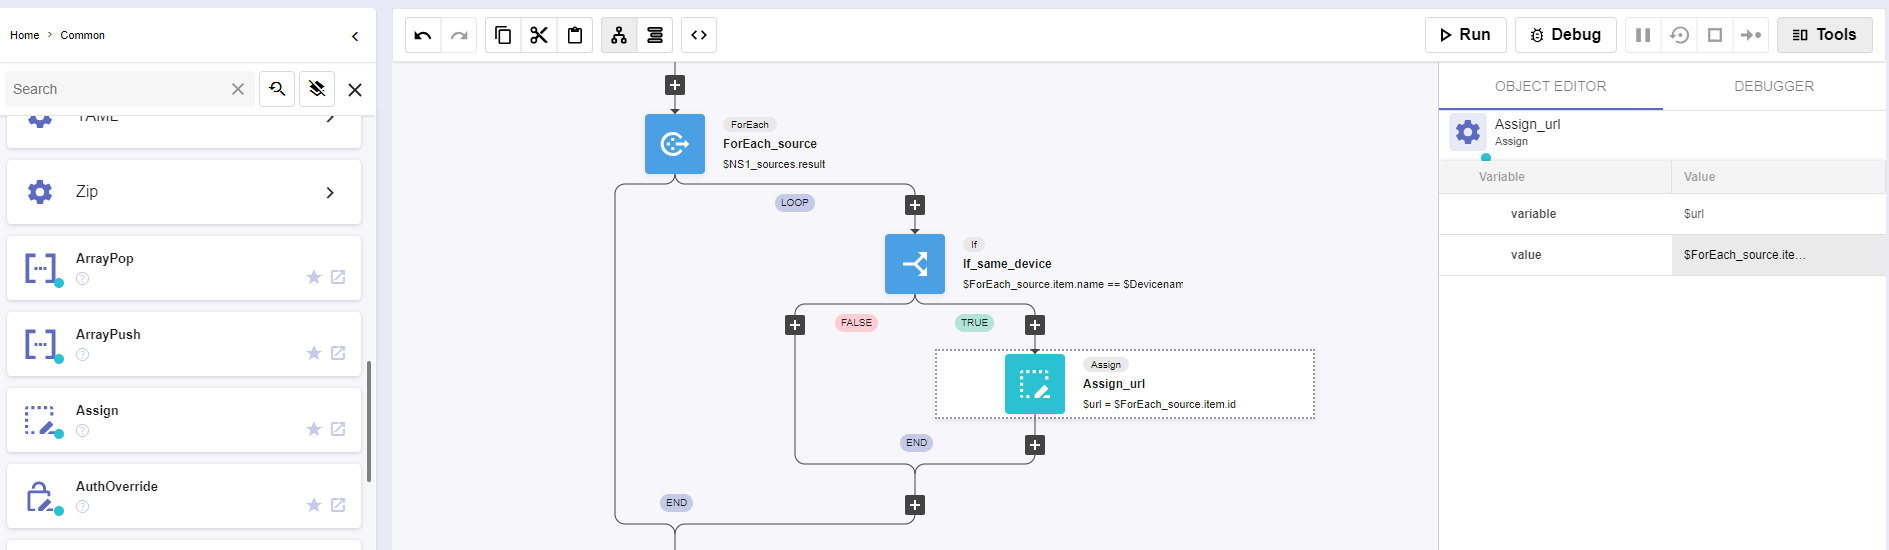
i. authKey: $NS1CredentialsAdd a new building block, Common -> ForEach
a. Change name to ForEach_source
b. Click on the building block to open the right side panel and complete the following fields
i. list: $NS1_sources.result
On the right side of the foreach, add a new building block, Common -> If
a. Change name to If_same_device
b. Click on the building block to open the right side panel and complete the following fields
i. condition: $ForEach_source.item.name == $DevicenameOn the TRUE side of the If, add a new building block, Common -> Assign
a. Change name to Assign_url
b. Click on the building block to open the right side panel and complete the following fields
i. variable: $url

ii. value: "https://api.nsone.net/v1/feed/" + $ForEach_source.item.id
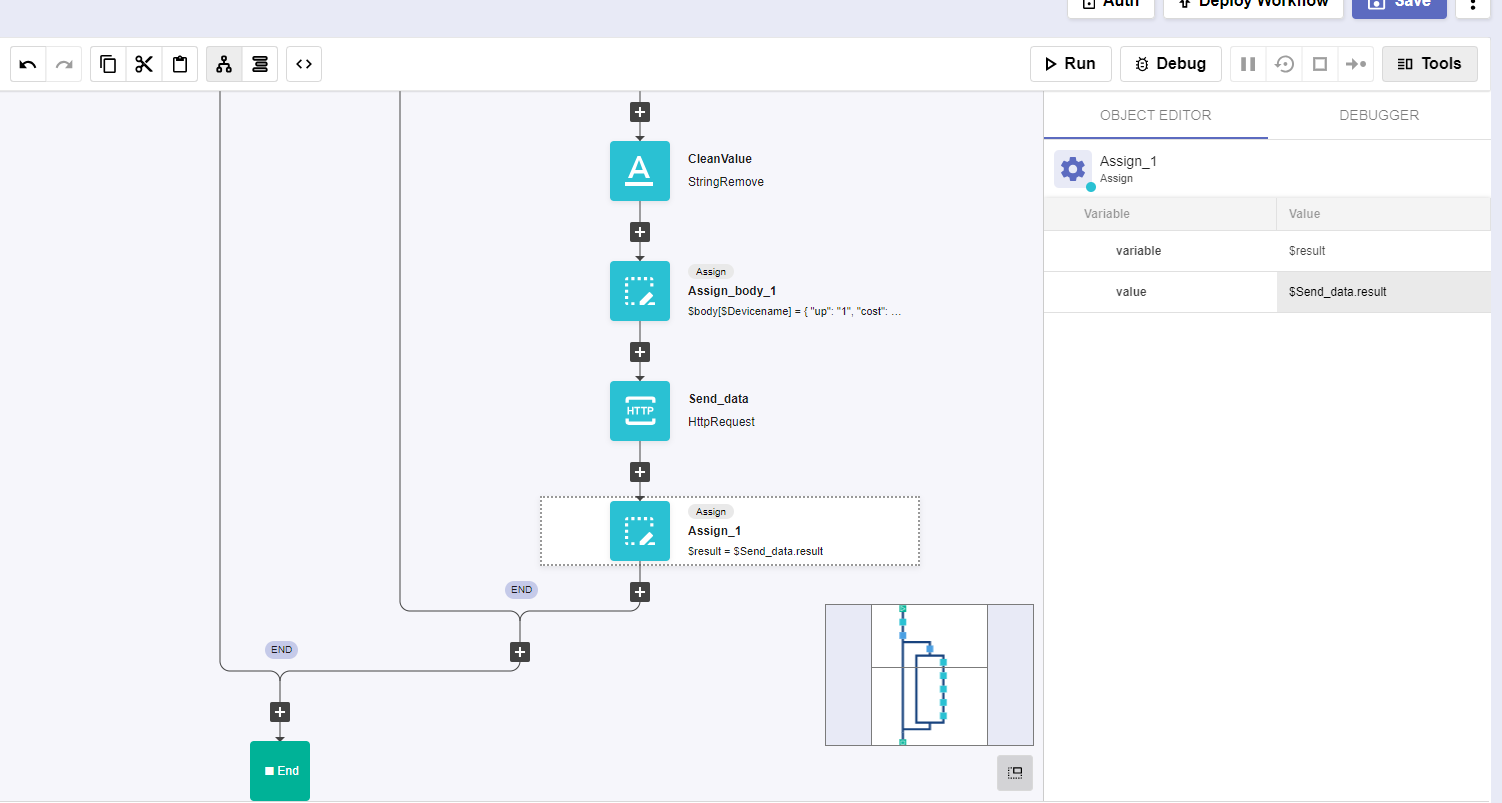
Add a new building block, Common -> String -> StringRemove
a. Change name to CleanValue
b. Click on the building block to open the right side panel and complete the following fields
i. str1: $Value

ii. str2: "Threshold triggered -- "
Add a new building block, Common -> Assign
a. Change name to Assign_body
b. Click on the building block to open the right side panel and complete the following fields
i. variable: $body[$Devicename]

ii. value:
{
"up": "1",

"cost": $CleanValue.result
}
Add a new building block, Common -> HttpRequest
a. Change name to Send_data
b. Click on the building block to open the right side panel and complete the following fields
i. method: POST

ii. host: $url

iii. protocol: https

iv. headers:
{
"X-NSONE-key": "PASTE_HERE_THE_KEY_FROM_NS1"
}
v. body: $body
Move the last building block of the workflow 'Assign_1' next to 'Send_data'. You can do 'drag and drop'
a. Change value to '$Send_data.result'
Click 'Save'
Go to APIs
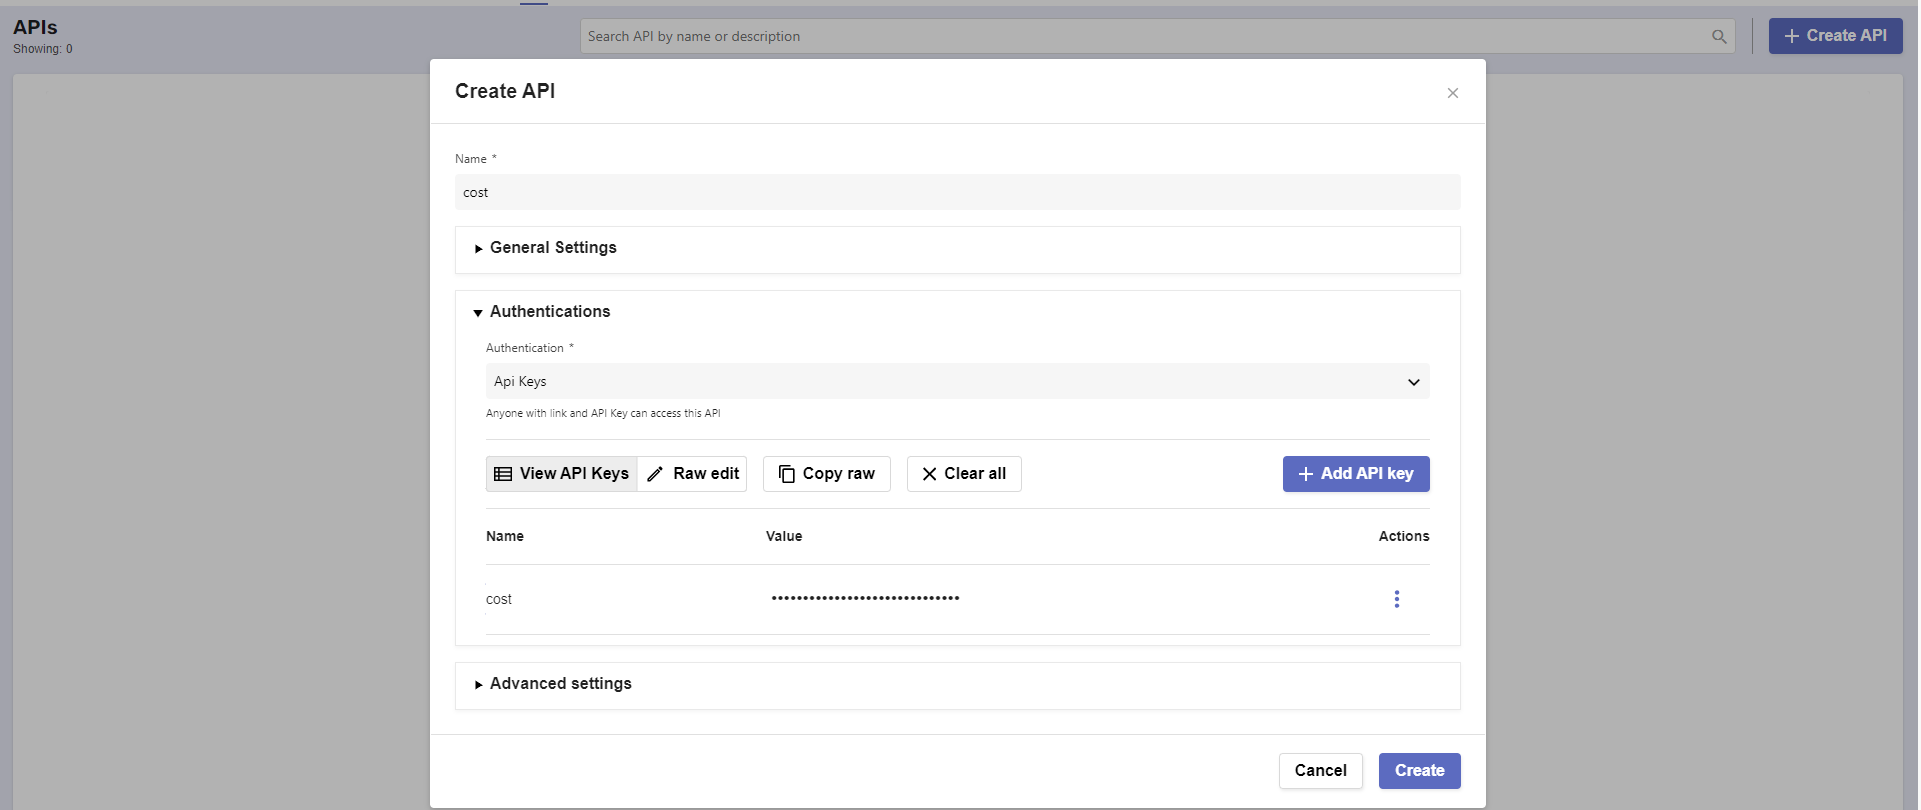
Click on Create API
a. Name: cost
b. Authentications
i. Authentication: API Keys

ii. Click ‘Add API Key’

    1. Name: cost

    2. Copy the api key for later use
c. Click ‘Create’
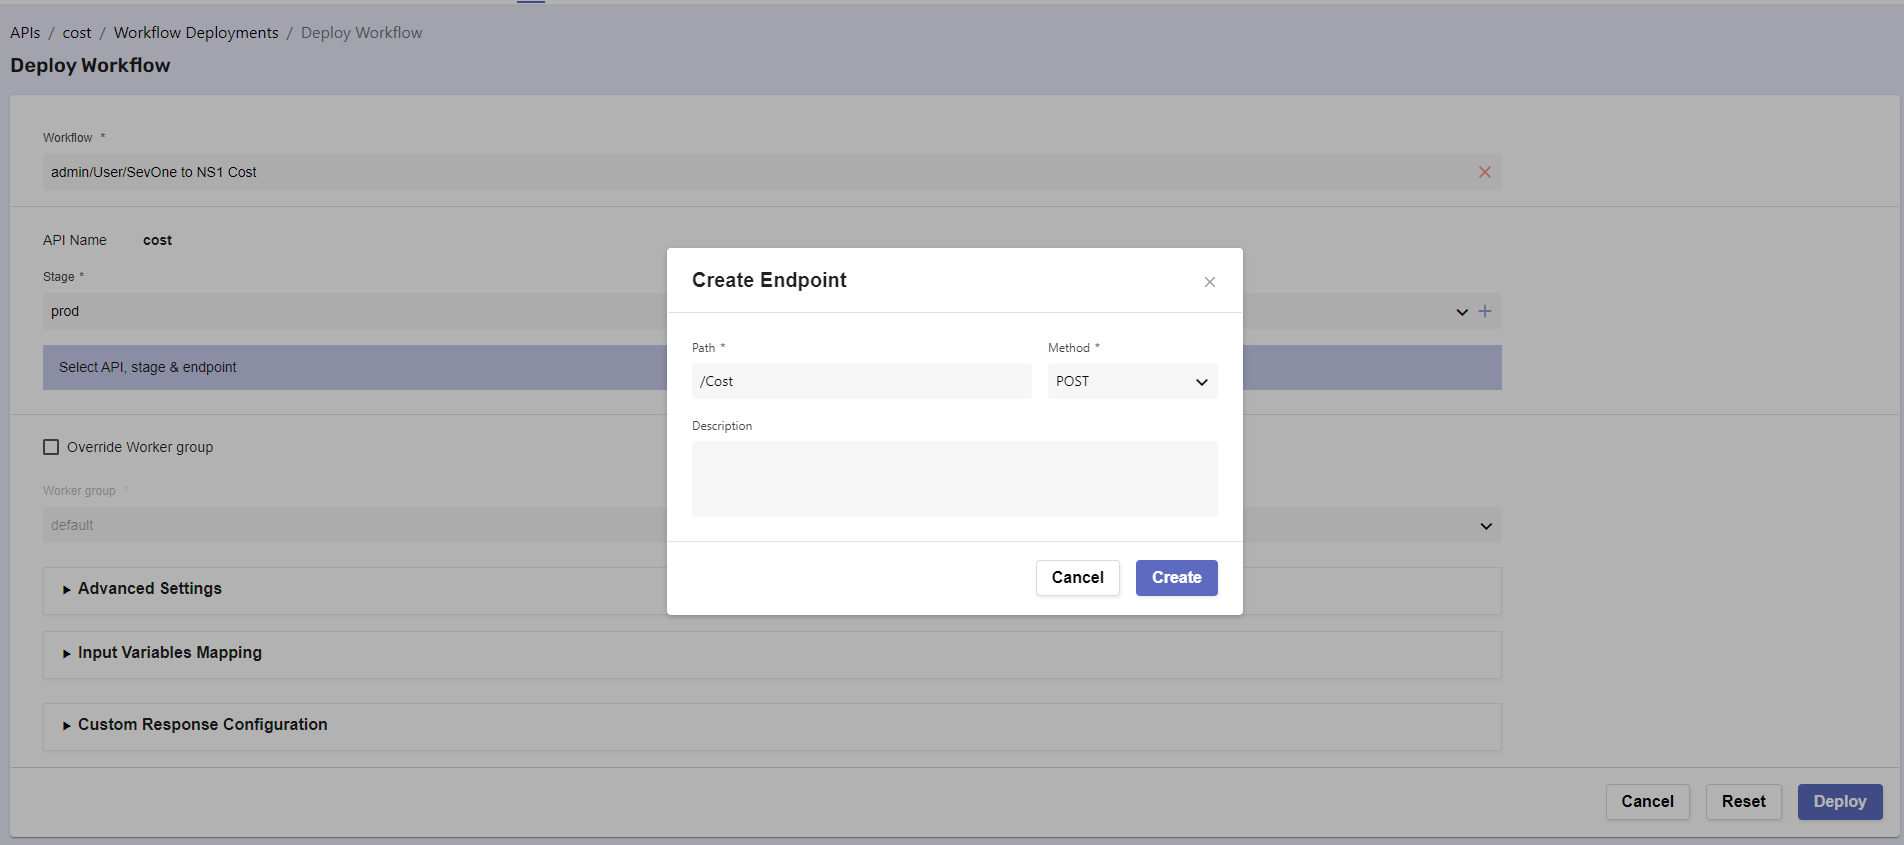
In workflow deployments, click ‘Create’
a. Workflow -> Choose the workflow you created clicking on the folder icon on the top right side of that field
b. Stage - > Click on + icon -> leave everything as it is, click 'Create'
c. Endpoint -> Click on + icon
i. Change Path to /Cost

ii. Method: POST

iii. Click ‘Create’
Click Deploy
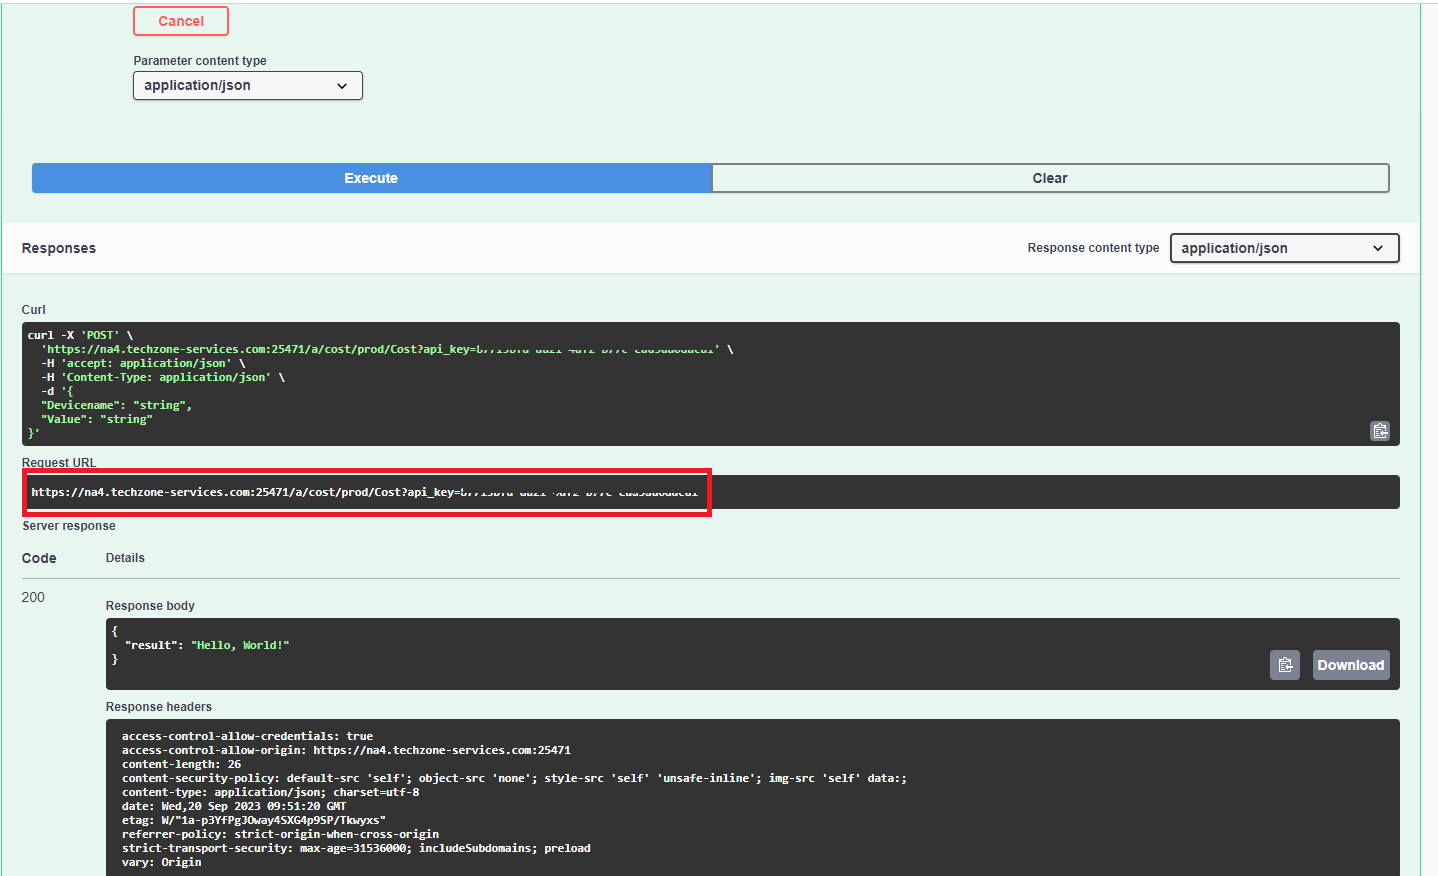
Click on Swagger UI
a. Click on Authorize
i. Paste the API Key copied before

ii. Click 'Authorize'

iii. Click 'Close'
b. Click 'Try it out'
c. Click 'Execute'
i. We don't care about the result, we want to get the request URL

ii. Copy the Request URL for future use
Send data to RNA using alerts
Go back to the SevOne GUI (vPAS)
Go to Events -> Configuration -> Webhook Definition Manager
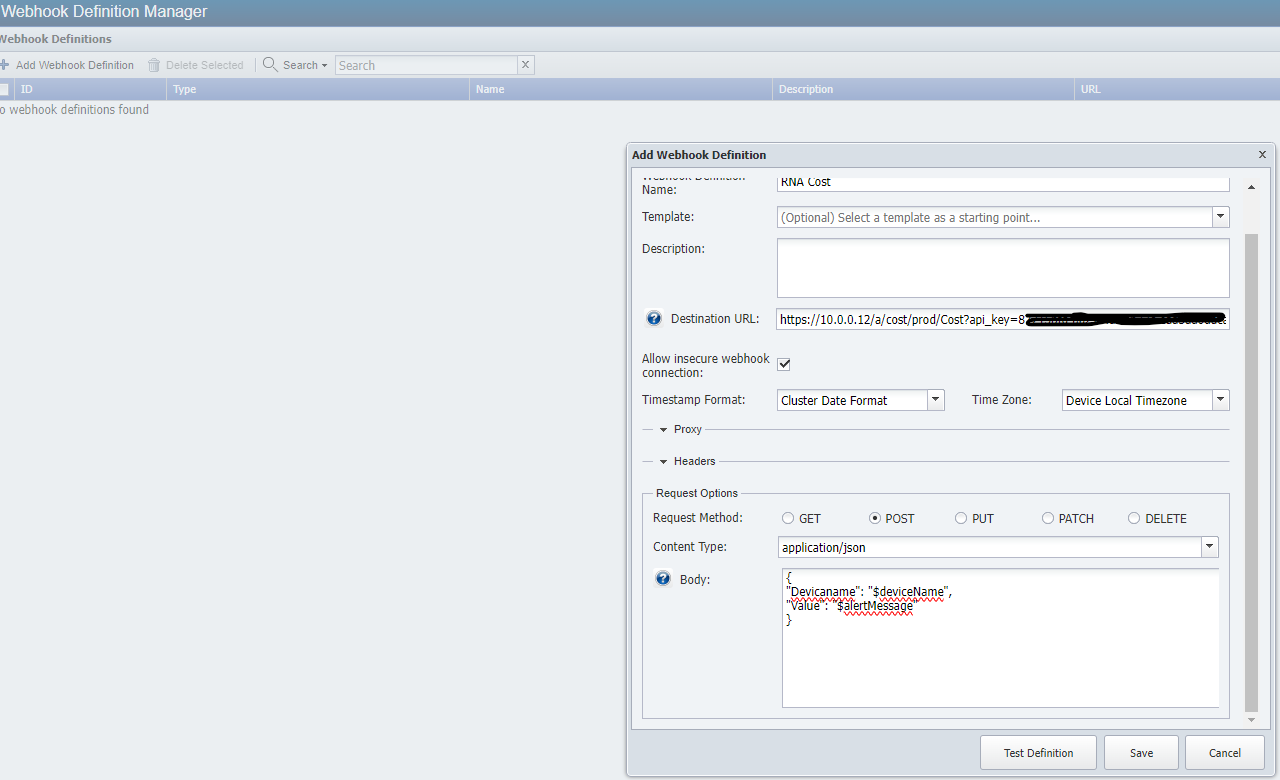
Click on Add Webhook Definition
a. Webhook Definition Name: RNA Cost
b. Destination URL: paste the Request URL from the four steps above
i. Replace 'na4.techzone-services.com:xxxxx' from the URL for '10.0.0.12'c. Allow insecure webhook connection: TRUE
c. Request Method: POST
d. Body:
{
"Devicename": "$deviceName",
"Value": "$alertMessage"
}
SevOne Alert Configuration
Go to Events -> Configuration -> Policy Browser
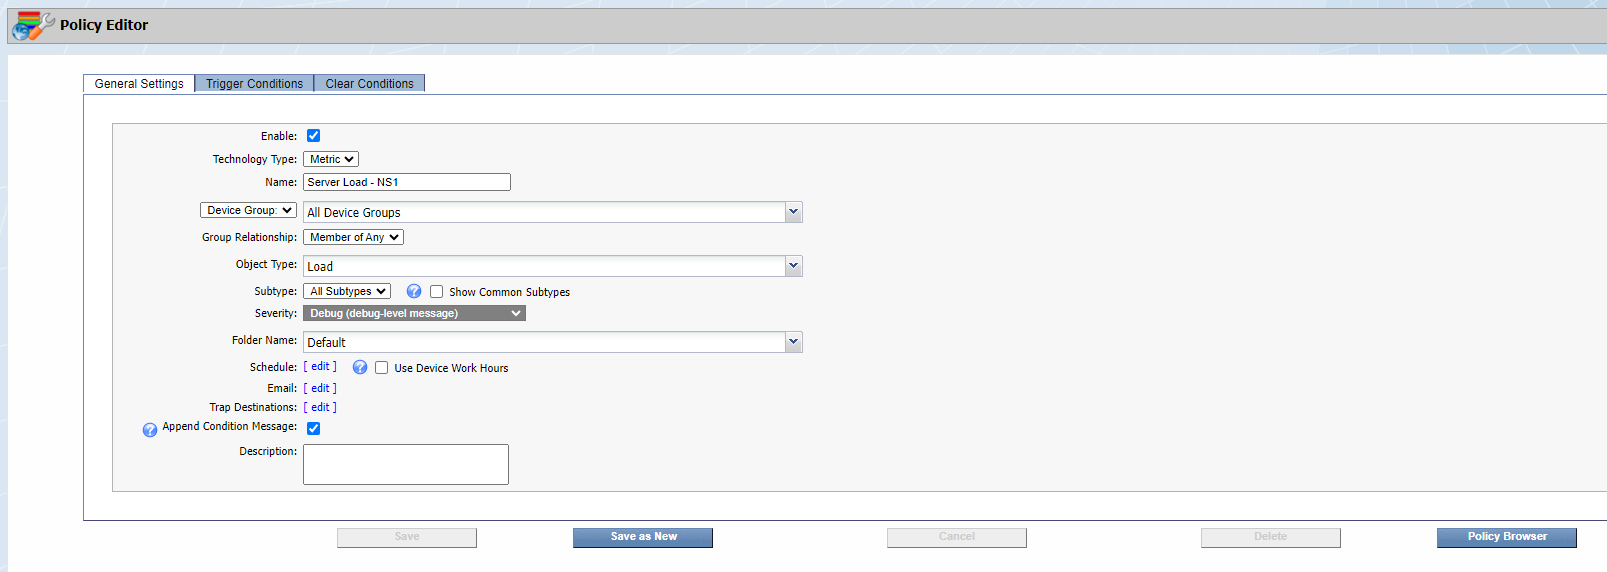
Click 'Create Policy'
a. Name: Server Load - NS1
b. Device Group: All device groups
c. Object type: Calculation Poller -> Load
d. Severity: Debug
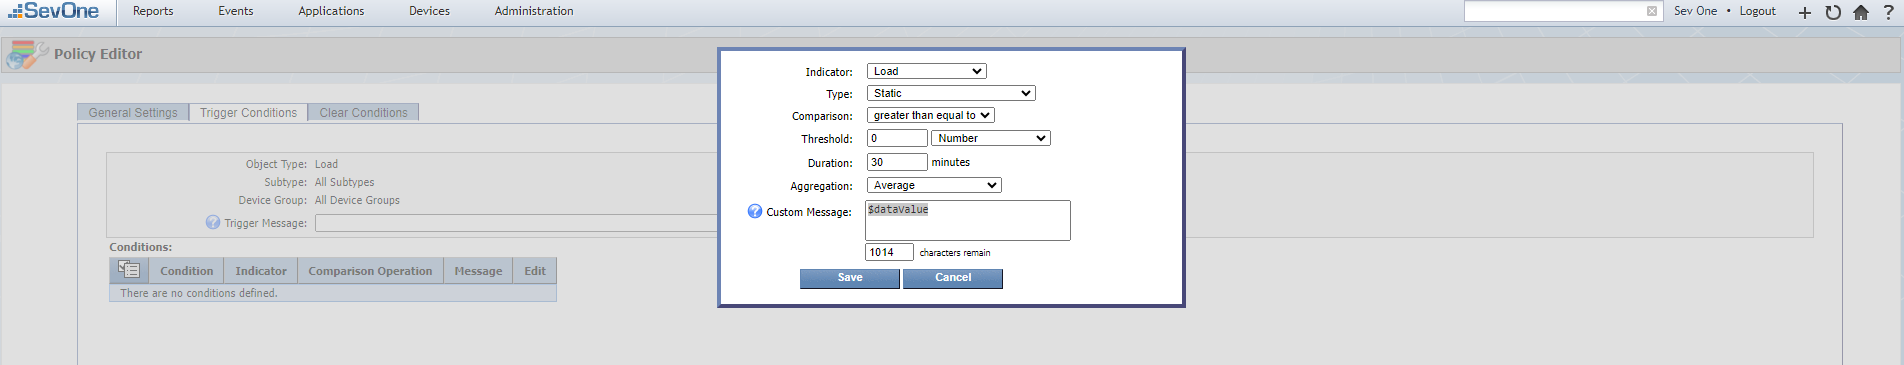
Click 'Trigger Conditions'
a. Under Conditions, click on the menu icon and click 'Create New'
i. Indicator: Load

ii. Type: Static

iii. Comparison: Greater than equal to

iv. Threshold: 0 Number **(not centinumber)**

v. Duration: 1

vi. Aggregation: Average

vii. Custom message: $dataValue
b. Under Webhooks:

    i. Enable 'Override Webhook per Alert'

    ii. Disable 'One webhook per Alert'

    iii. Move 'RNA Cost' to the right side
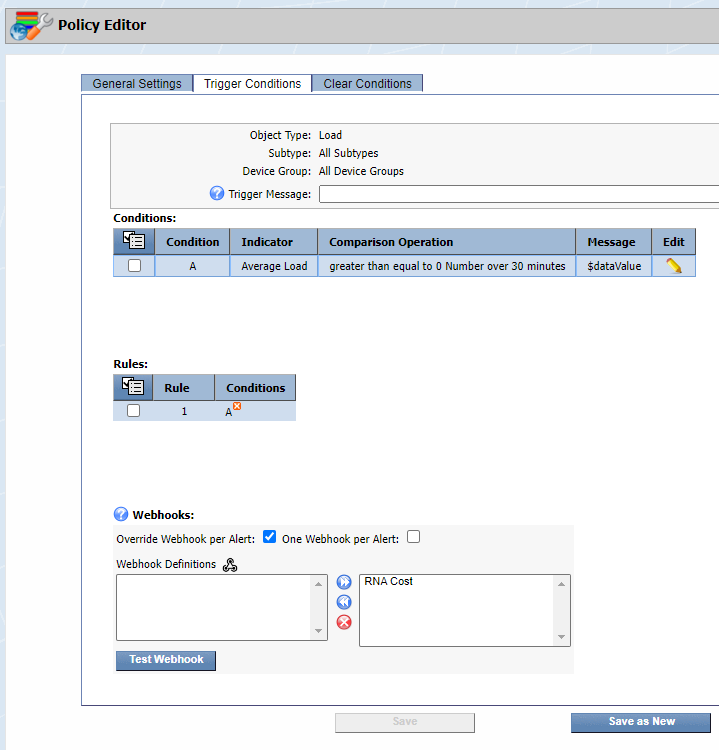
c. Click 'Save as New'
NS1 Configuration
NOTE: If there is any configuration from another lab, please delete all the NS1 configurations as some of them may impact this lab. This includes DNS records, filter chains, monitors, etc...
Log into https://my.nsone.net/ with your username and password
Navigate to the DNS tab
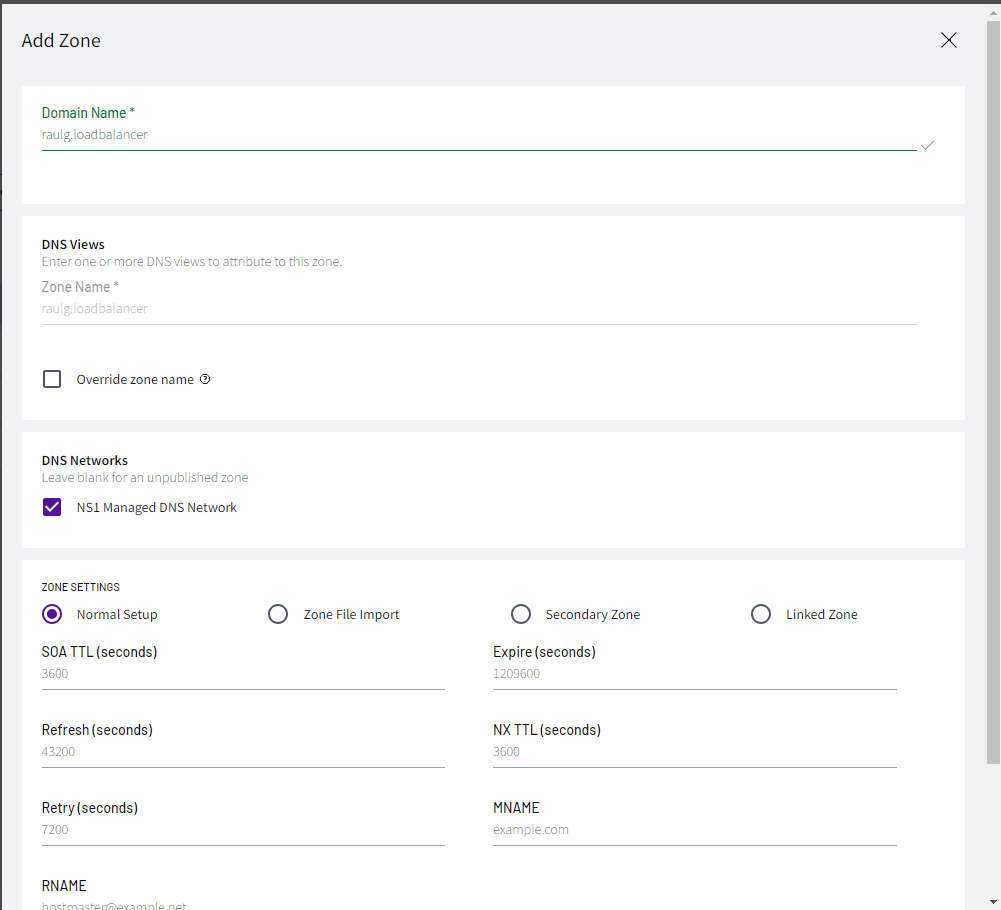
Click the + icon on the top right side
a. Domain name: yourname.loadbalancer (raulg.loadbalancer)
b. leave all the other settings as is
c. Click 'Save Zone'
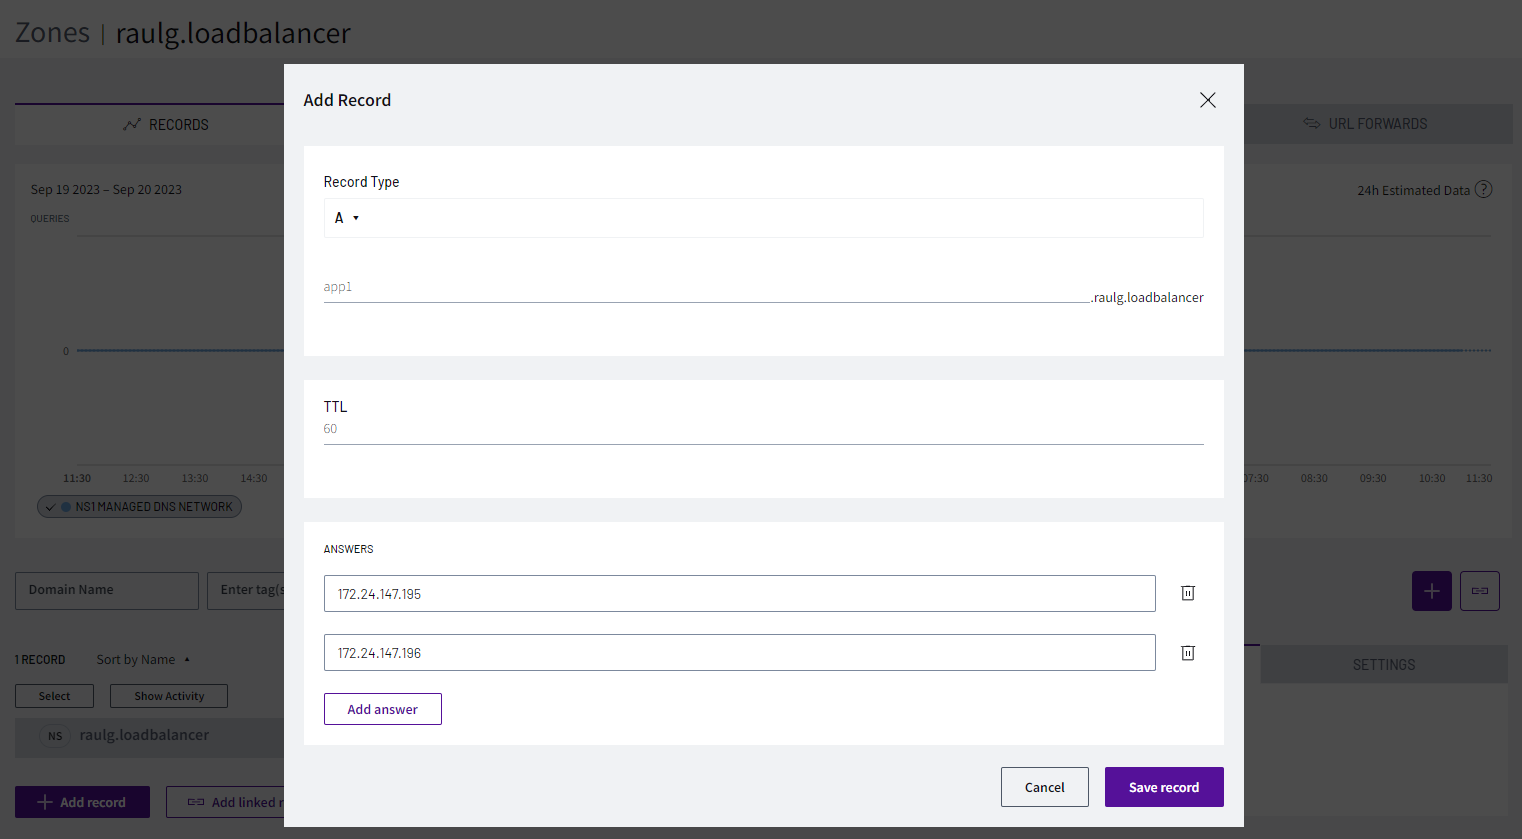
Click the '1 Record' box next to the zone just created
Click 'Add record'
a. Record Type: A
b. name: app1
c. TTL: 60
d. Answers:
i. 172.24.147.195

ii. 172.24.147.196
- Click 'Save Record'
- Click on '2 answers' on app1.yourname.loadbalancer
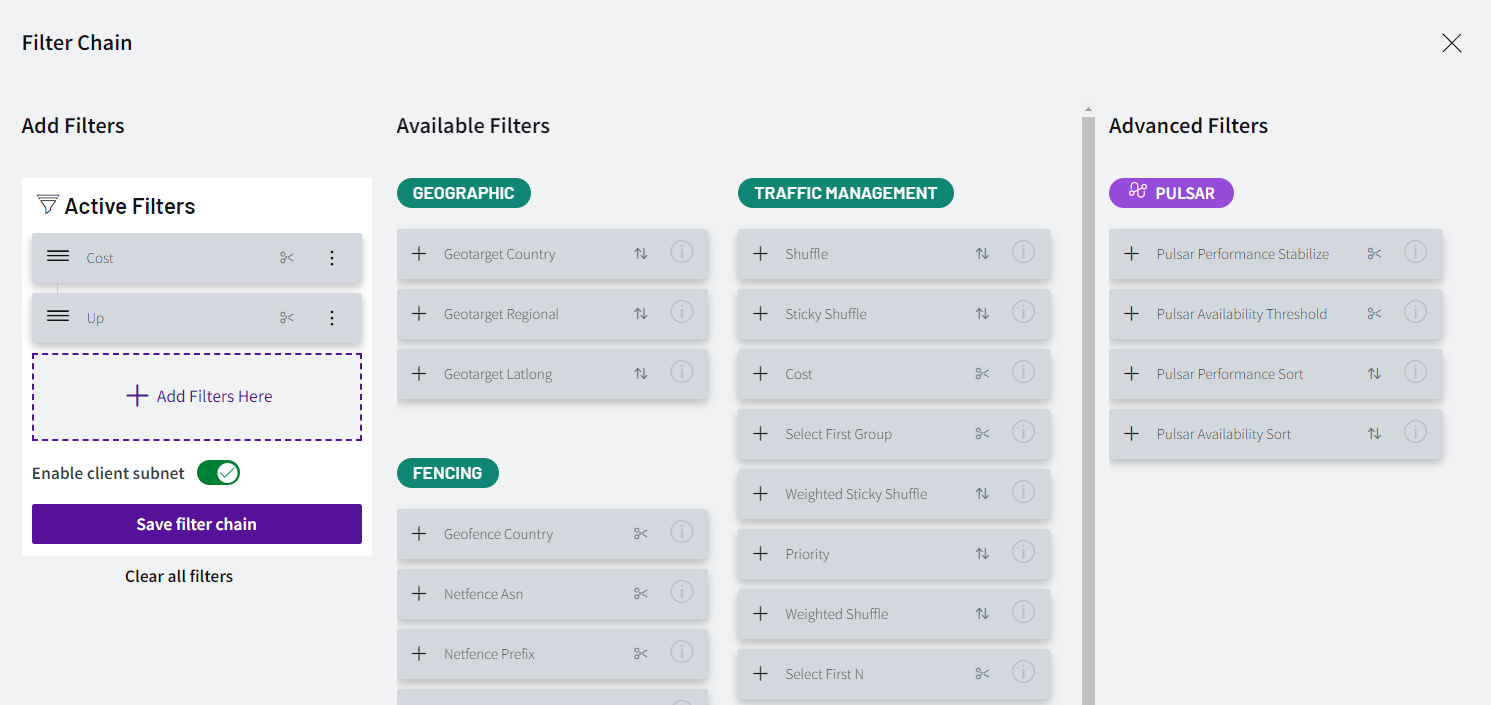
Click 'Create Filter Chain'
a. Click the '+' icon next to the 'Cost' filter
b. Click the '+' icon next to the 'Up' filter
d. Click 'Save Filter Chain'
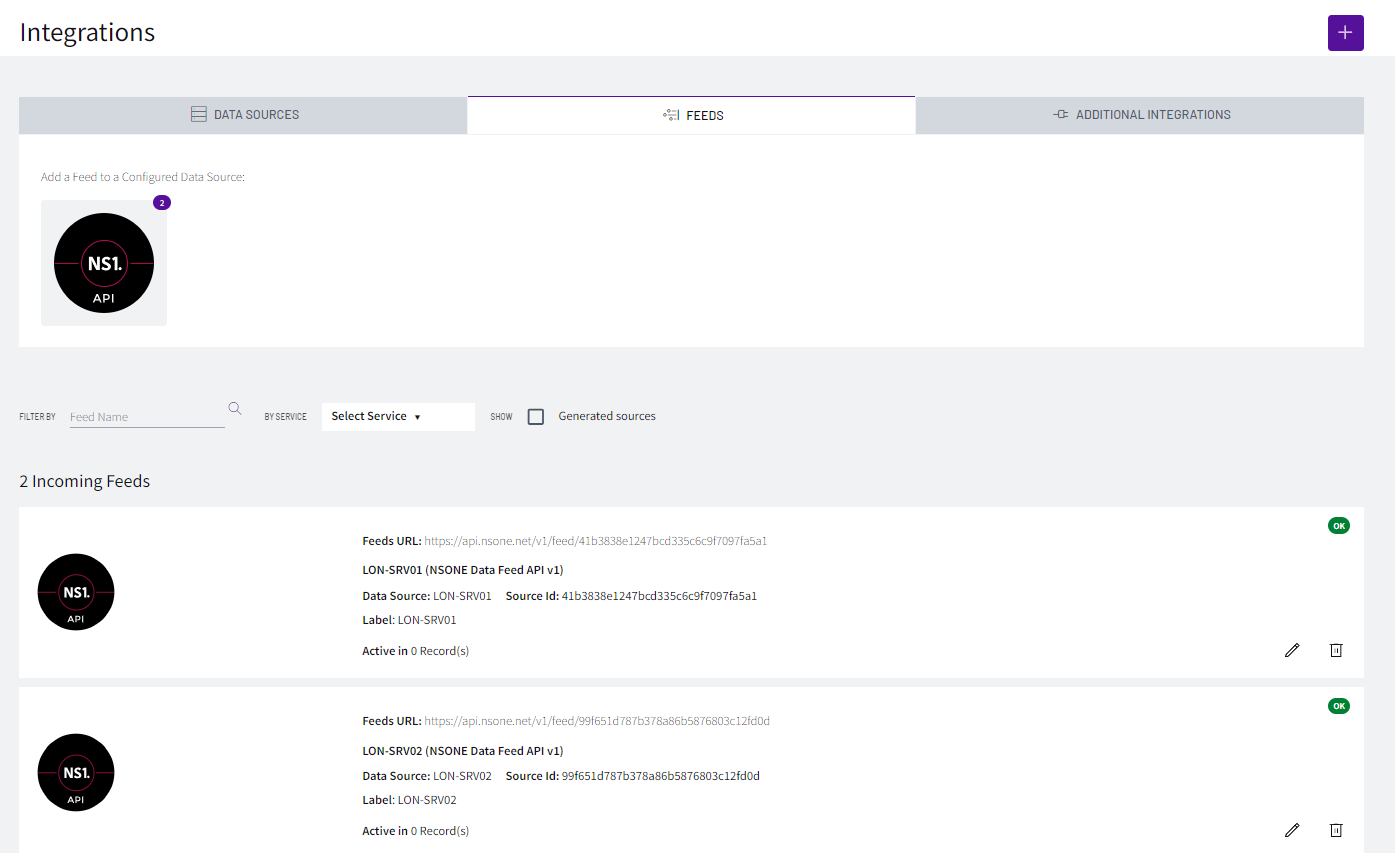
Let's create the integrations to read the cost from SevOne data. Click on 'Integrations' (top bar)
a. Click on the + icon on the top right to create a Data Source
i. NS1 API integration

ii. Name: LON-SRV01

iii. Click on 'Create a new feed with this data source?'

    1. Name: LON-SRV01

    2. Label: LON-SRV01

iv. Click 'Save changes'
b. Go back to Data Sources and click the + icon to do the same with the other server
i. NS1 API integration

ii. Name: LON-SRV02

iii. Click on 'Create a new feed with this data source?'

    1. Name: LON-SRV02

    2. Label: LON-SRV02

iv. Click 'Save changes'
Go back to DNS -> yourname.loadbalancer -> app1.yourname.loadbalancer, click in the middle of the 'Cost' filter to highlight the up metadata on the answers
a. Click on 'cost: unset' of the first answer (172.24.147.195)
i. click on the feed icon and select LON-SRV01

ii. Click 'OK'
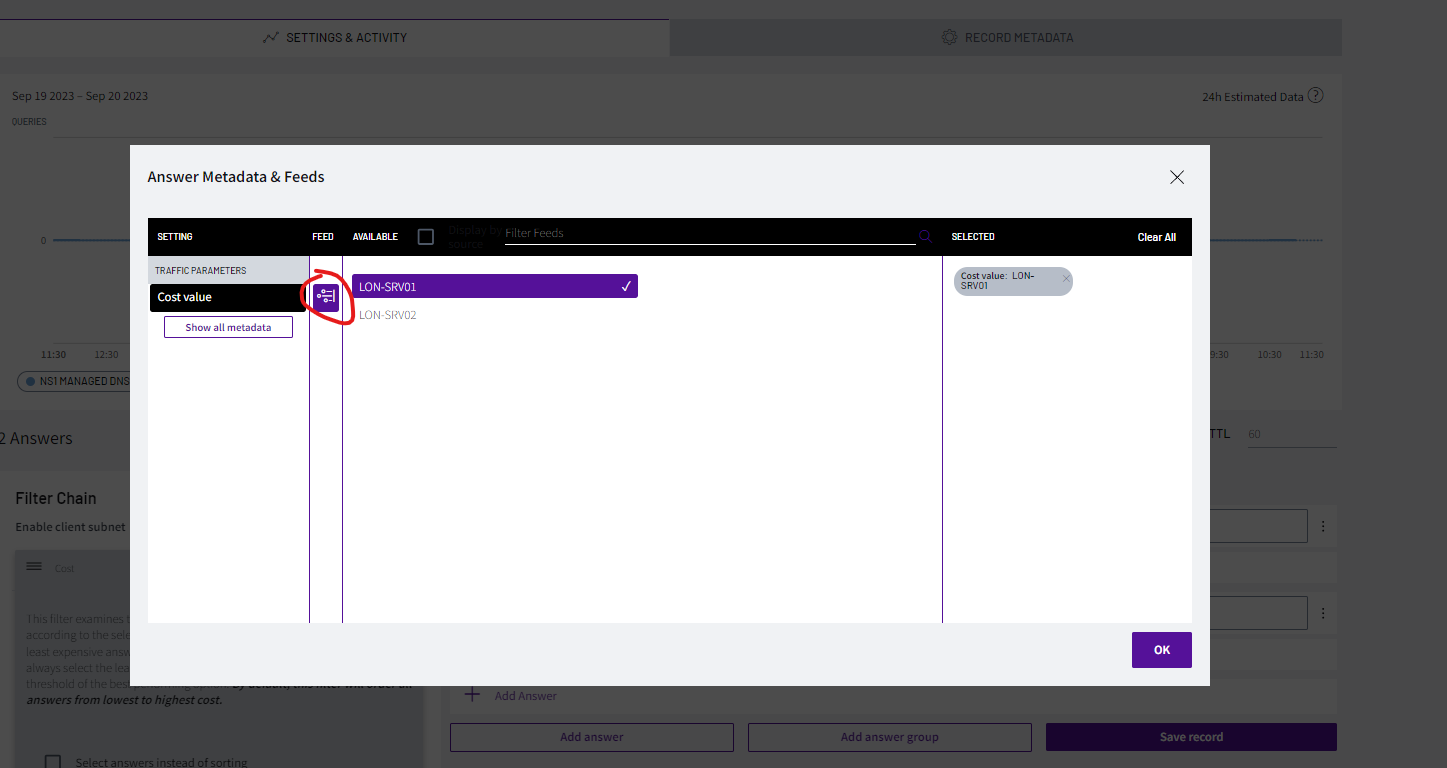
b. Click on 'cost: unset' of the first answer (172.24.147.196)
i. click on the feed icon and select LON-SRV02
ii. Click 'OK'
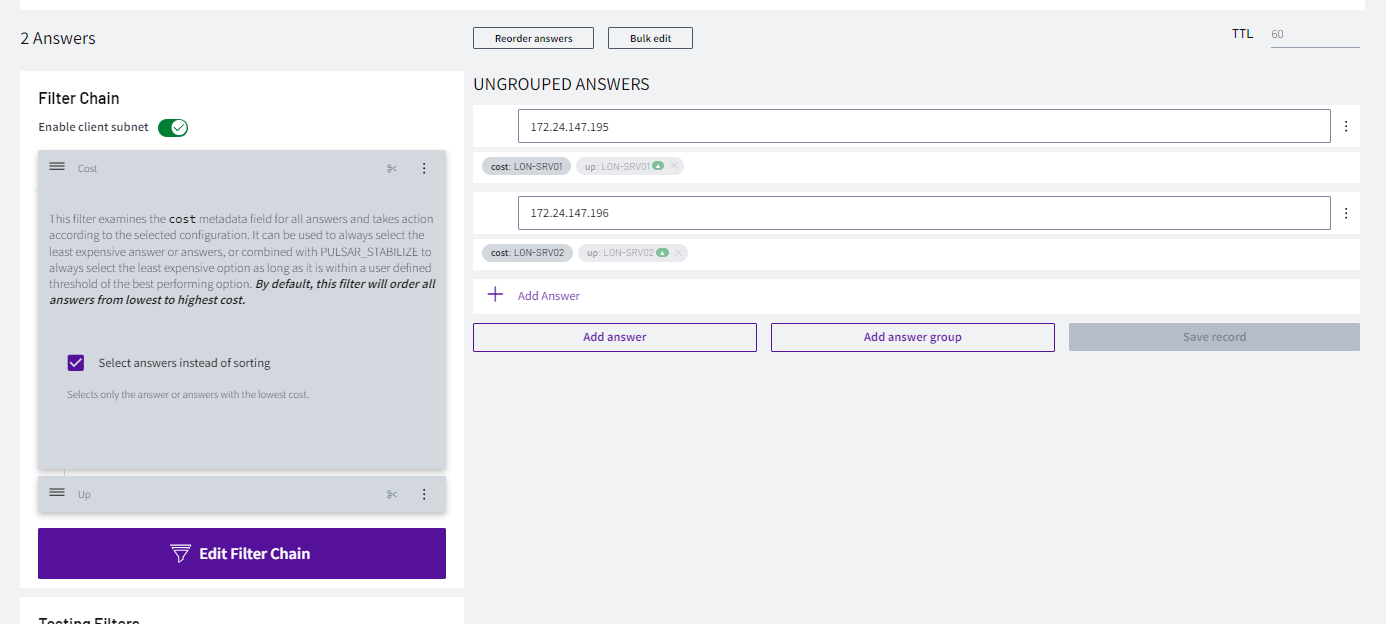
c. Enable the option 'Select answers instead of sorting' inside the 'Cost' box on the left hand side
- Click in the middle of the 'Up' filter to highlight the up metadata on the answer
a. Click on 'cost: unset' of the first answer (172.24.147.195)

    i. click on the feed icon and select LON-SRV01

    ii. Click 'OK'
b. Click on 'cost: unset' of the first answer (172.24.147.196)

    i. click on the feed icon and select LON-SRV02

    ii. Click 'OK'
- Click 'Save record'
NOTE: It will take a minute for the UP monitors to show up. Don't get alarmed if they show red for one minute or two
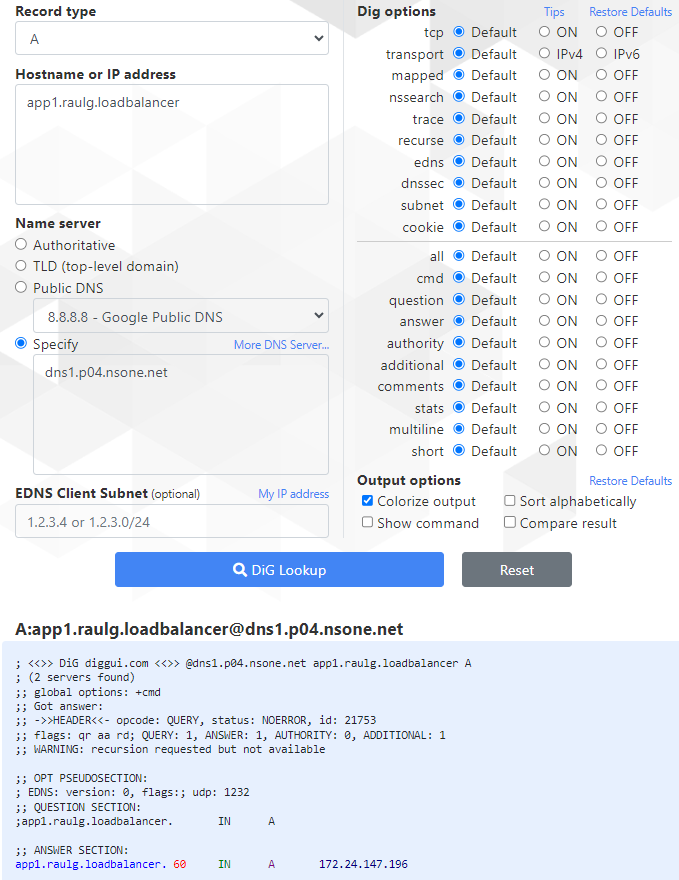
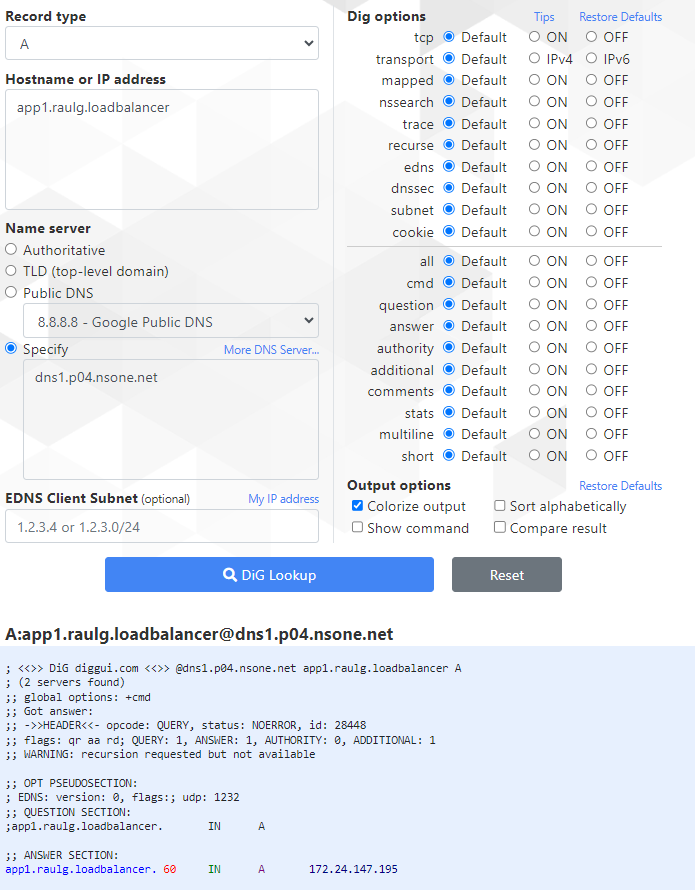
Now it's time to test which result we get back based on the load of the server. Test the results with command:
a. dig @dns1.p04.nsone.net app1.YOURNAME.loadbalancer
i. dig @dns1.p04.nsone.net app1.raulg.loadbalancer
Let's force the other result to appear by editing the formular
Go back to SevOne (vPAS) and go to Administration -> Monitoring Configuration -> Calculation Editor
a. In my case the server with less load is LON-SRV01, therefore I will click on 'Load' on that device and edit the formula
i. Indicator Expression: ${cpu}+${conn} + 1000000

ii. Click 'Save'
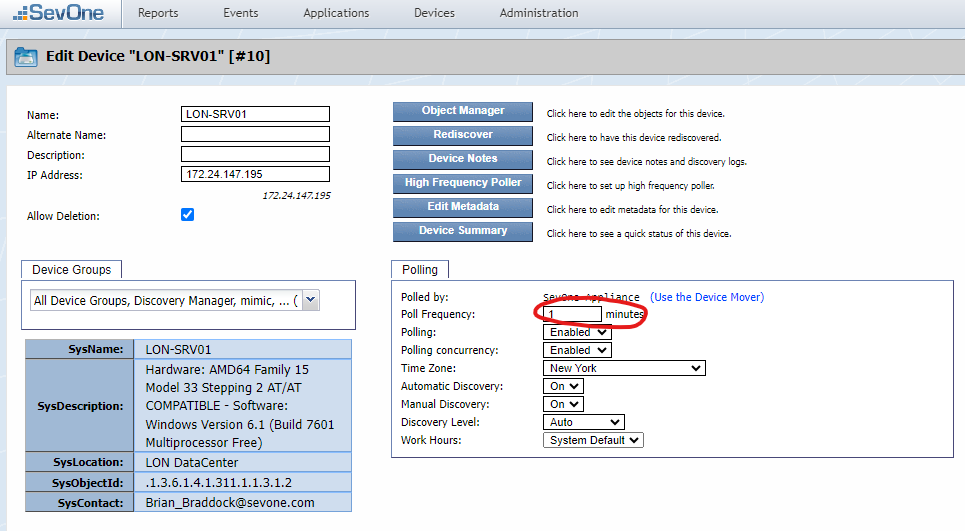
- As we poll every 5 minutes by default, we can speed up the process by editing the devices in SevOne and change the polling frequency to 1 minute, and check the results again in 3-4 minutes
Otherwise we can wait around 10 minutes and test again the results:
a. dig @dns1.p04.nsone.net app1.YOURNAME.loadbalancer
i. dig @dns1.p04.nsone.net app1.raulg.loadbalancer